
Measuring What matters in enterprise ai: Lessons from four years of the wharton-gbk ai adoption report
The Adaptive Advantage, the fourth annual study from Wharton Human-AI Research and GBK Collective, opens with a number that sounds like good news: 80% of enterprise leaders report positive returns from AI. The more useful number is 7%, the share of leaders whose organizations clear all three of the report's markers of success.
Both come from the same survey of 1,416 respondents (1,007 of these enterprise leaders as well as 409 entry-/mid-level employees), and the distance between them is a measurement story. As in prior waves, Wharton directed the research agenda, provided academic direction and published the report. GBK designed the instrument and sample, ran the study and analytics, and generated the insights. Having led the inaugural study in 2023, GBK has fielded every wave since, providing a consistent yardstick across four years of change.
Four consistent waves also let the study check its own forecasts. The 2025 report predicted that enterprises would rewire core workflows and deploy agentic systems in 2026, and both happened. This year's data also caught a first for the series: usage and sentiment moved in opposite directions, with daily use up 16 points to 62% while the share of managers who describe themselves as excited about AI fell 8 points. A one-time survey can describe a moment. A tracker built on stable questions can show when the direction changes. Four design decisions shaped what this year's data could reveal.
01 Defining Success Before Measuring It
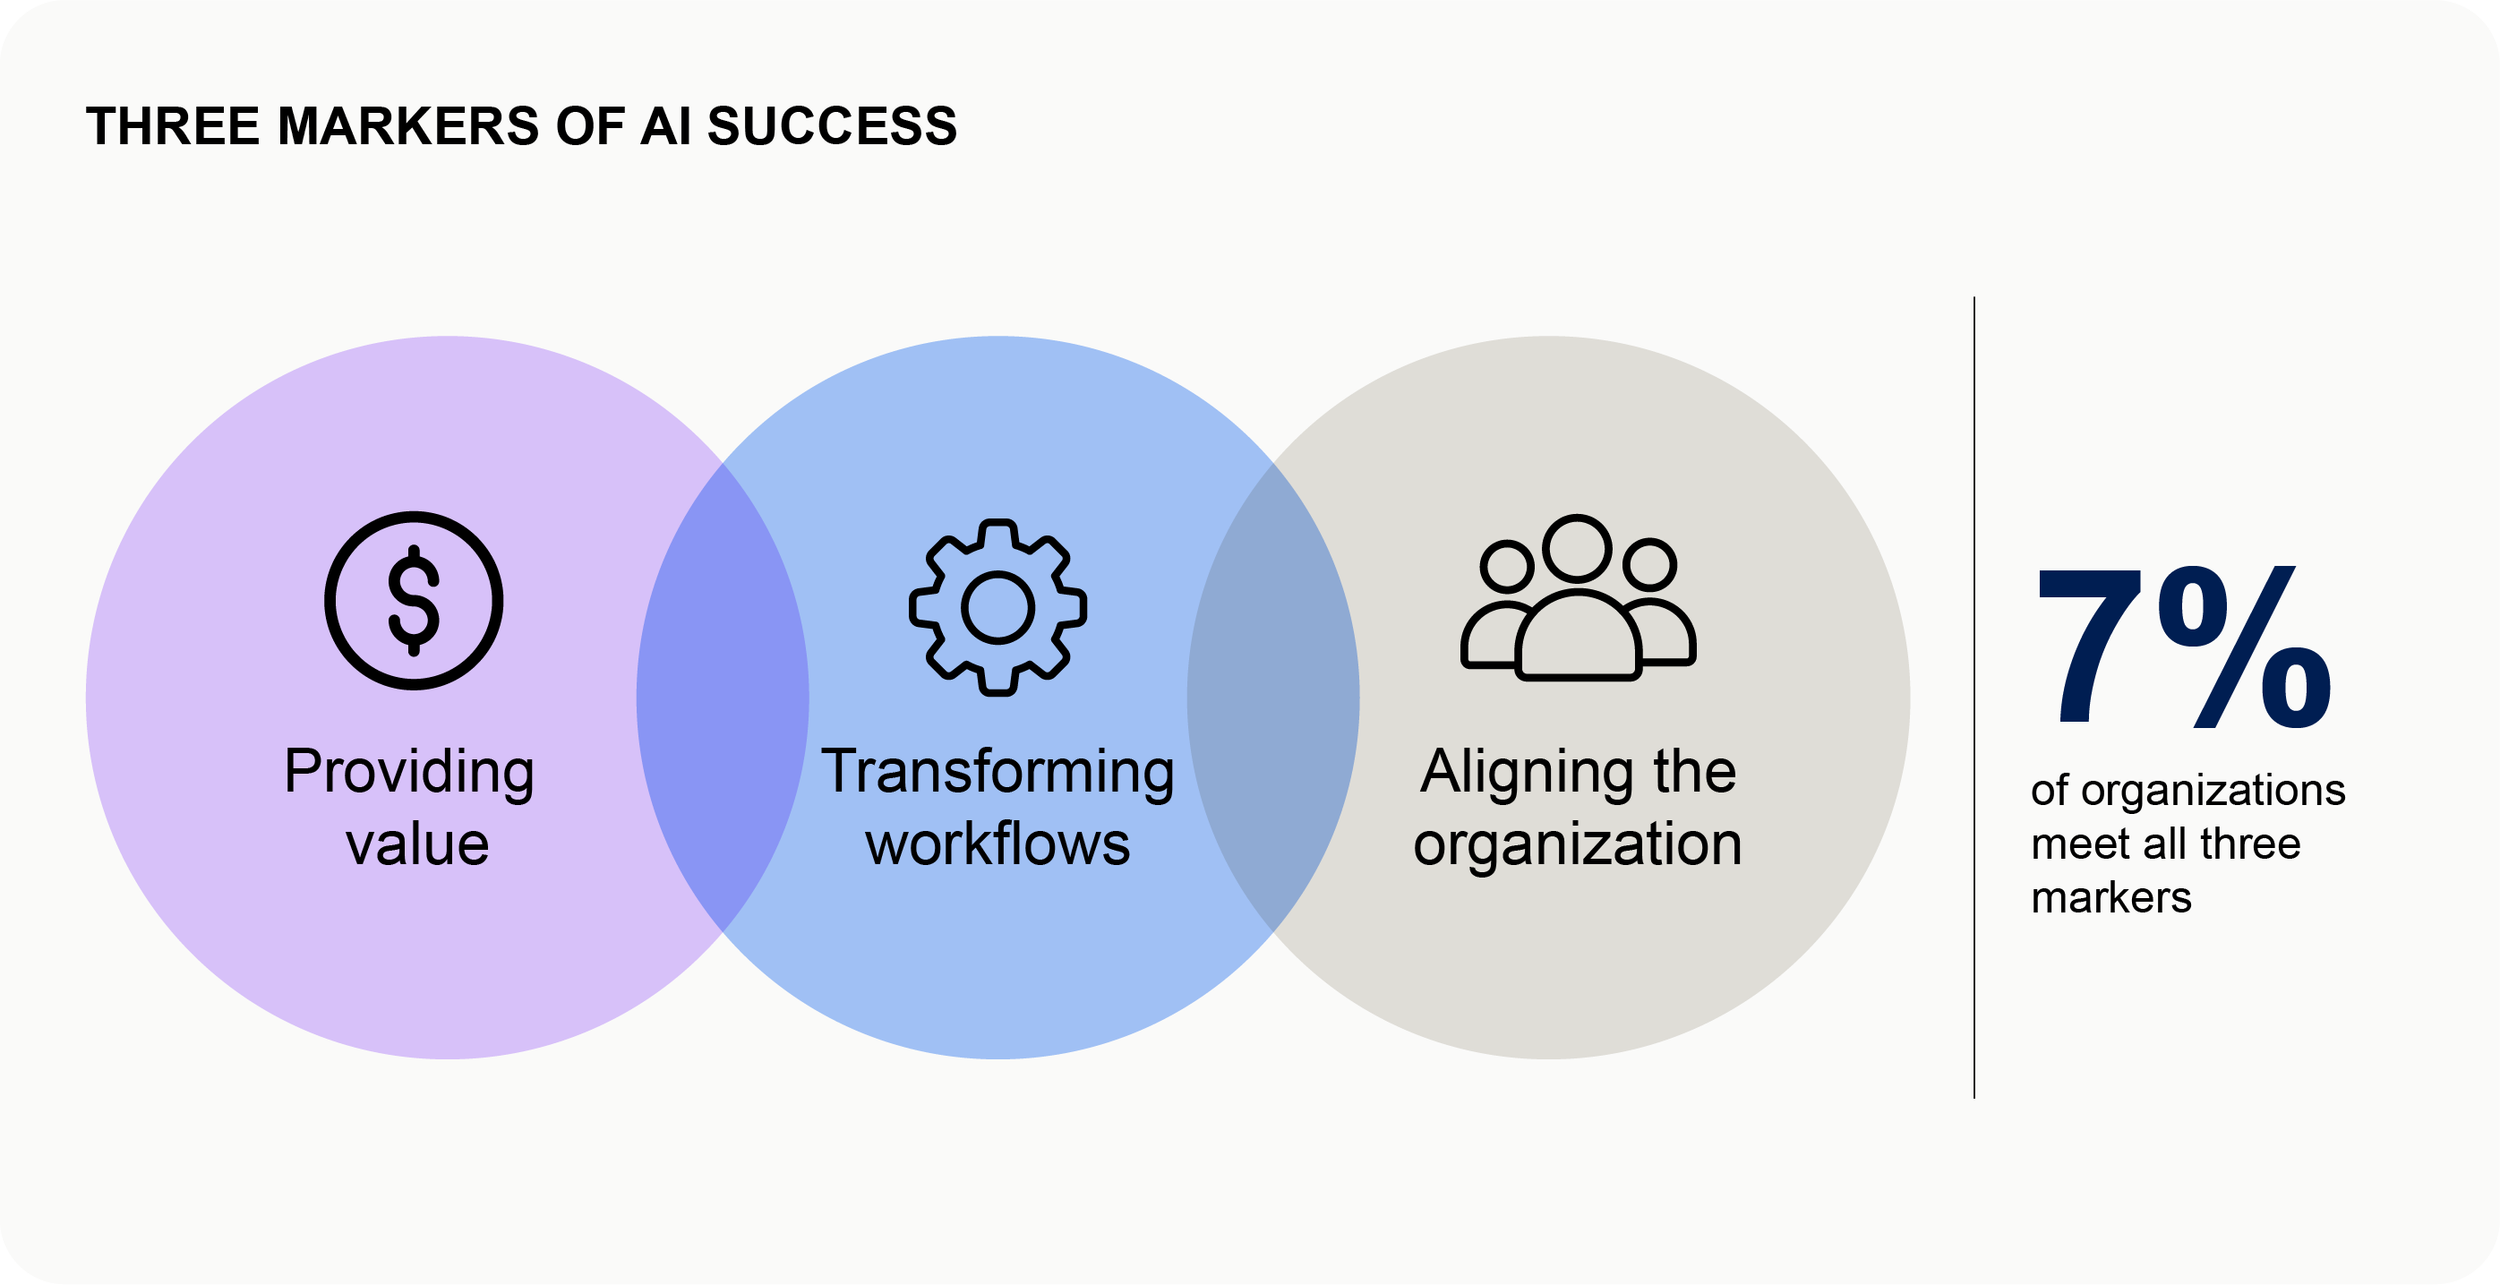
Self-reported ROI is a generous measure, since many respondents are grading programs they might own. So the report does not stop there. It defines three separate markers of AI success (proving value, transforming workflows and aligning the organization), each with explicit conditions. Proving value requires strongly positive ROI from a department that formally measures it. Workflow transformation requires AI fully embedded in core processes, use of agents in some form, and significantly changed workflows. While 67% of departments use agents and 73% say their workflows have changed, just 20% meet all three conditions. Success on the organizational alignment marker requires four of these five factors: employees receive adequate AI training, leadership has set out a clear long-term vision, people have meaningful choice over how and when they use AI, the department avoids being held back by people and processes rather than by the technology, and there is no real resistance among colleagues. Only 7% of organizations meet all three markers. A looser definition would have produced a more favorable figure and a less useful one.
02 Hearing from the Workforce as Well as Leadership
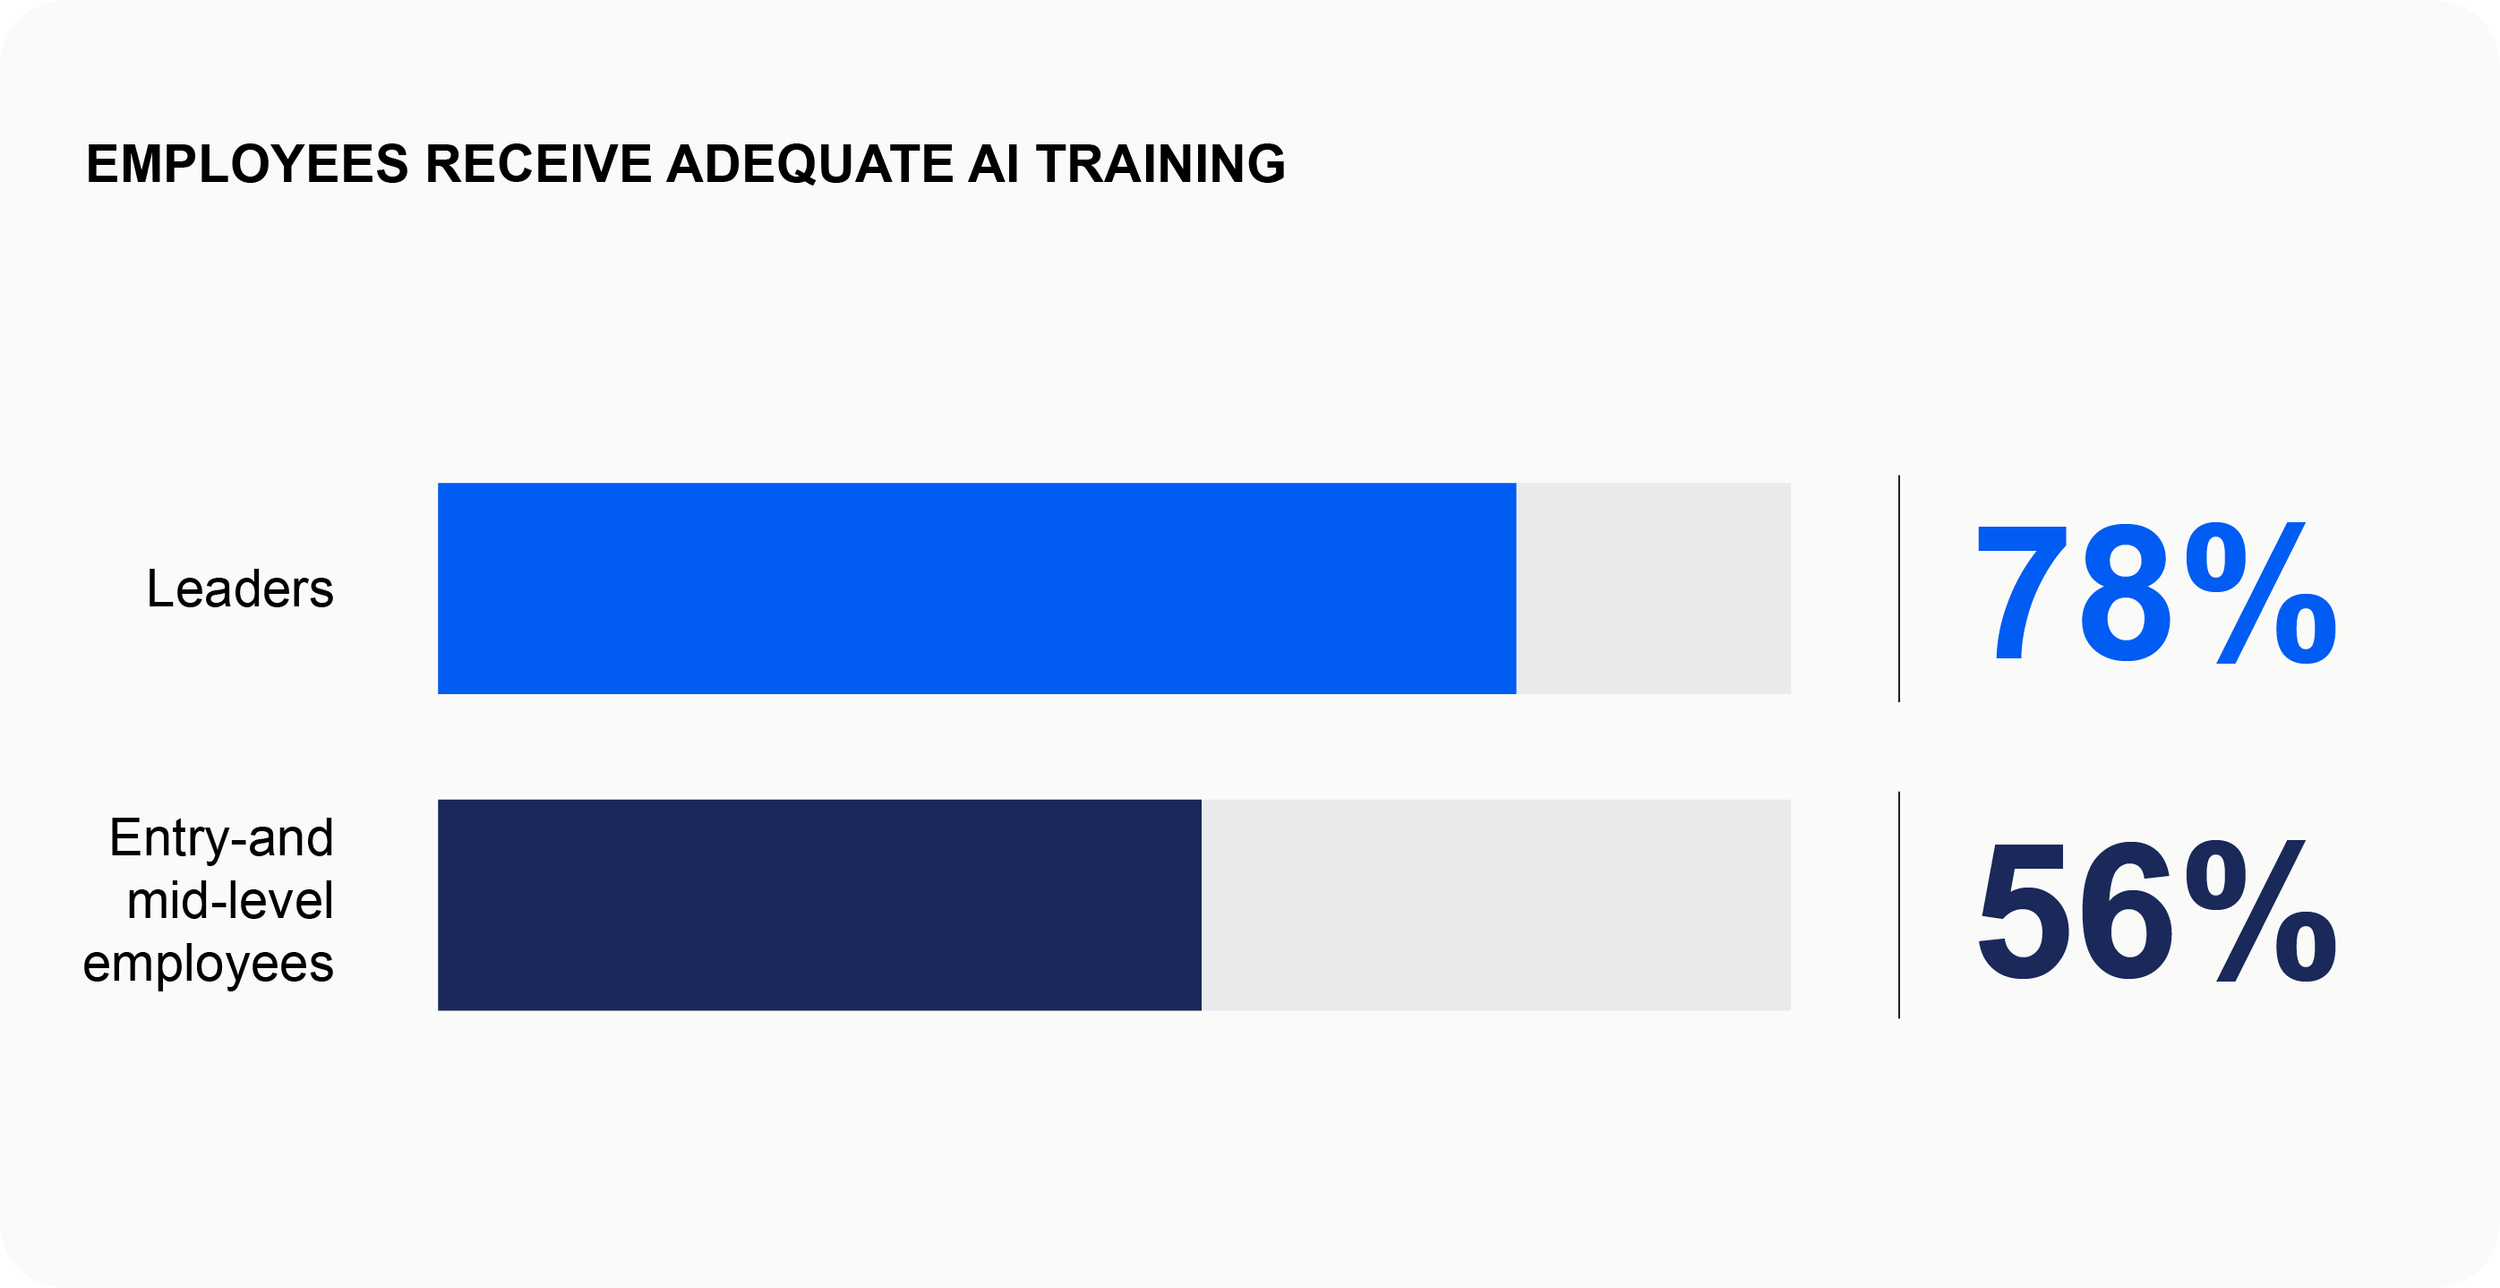
Every prior wave surveyed enterprise leaders only. This year we added 409 entry- and mid-level employees, so that the difference between leadership's view and the workforce's could be measured rather than assumed. The gap appears on nearly every readiness measure and is widest on training: 78% of leaders believe employees receive adequate AI training, against 56% of employees. Employees like the technology itself, with 73% saying AI has had a positive effect on their own role, and 84% of those who use it saying it saves them time. What they doubt is the support around it. A leader-only design would have missed that distinction.
03 Maintaining Comparability and Disciplined Inference
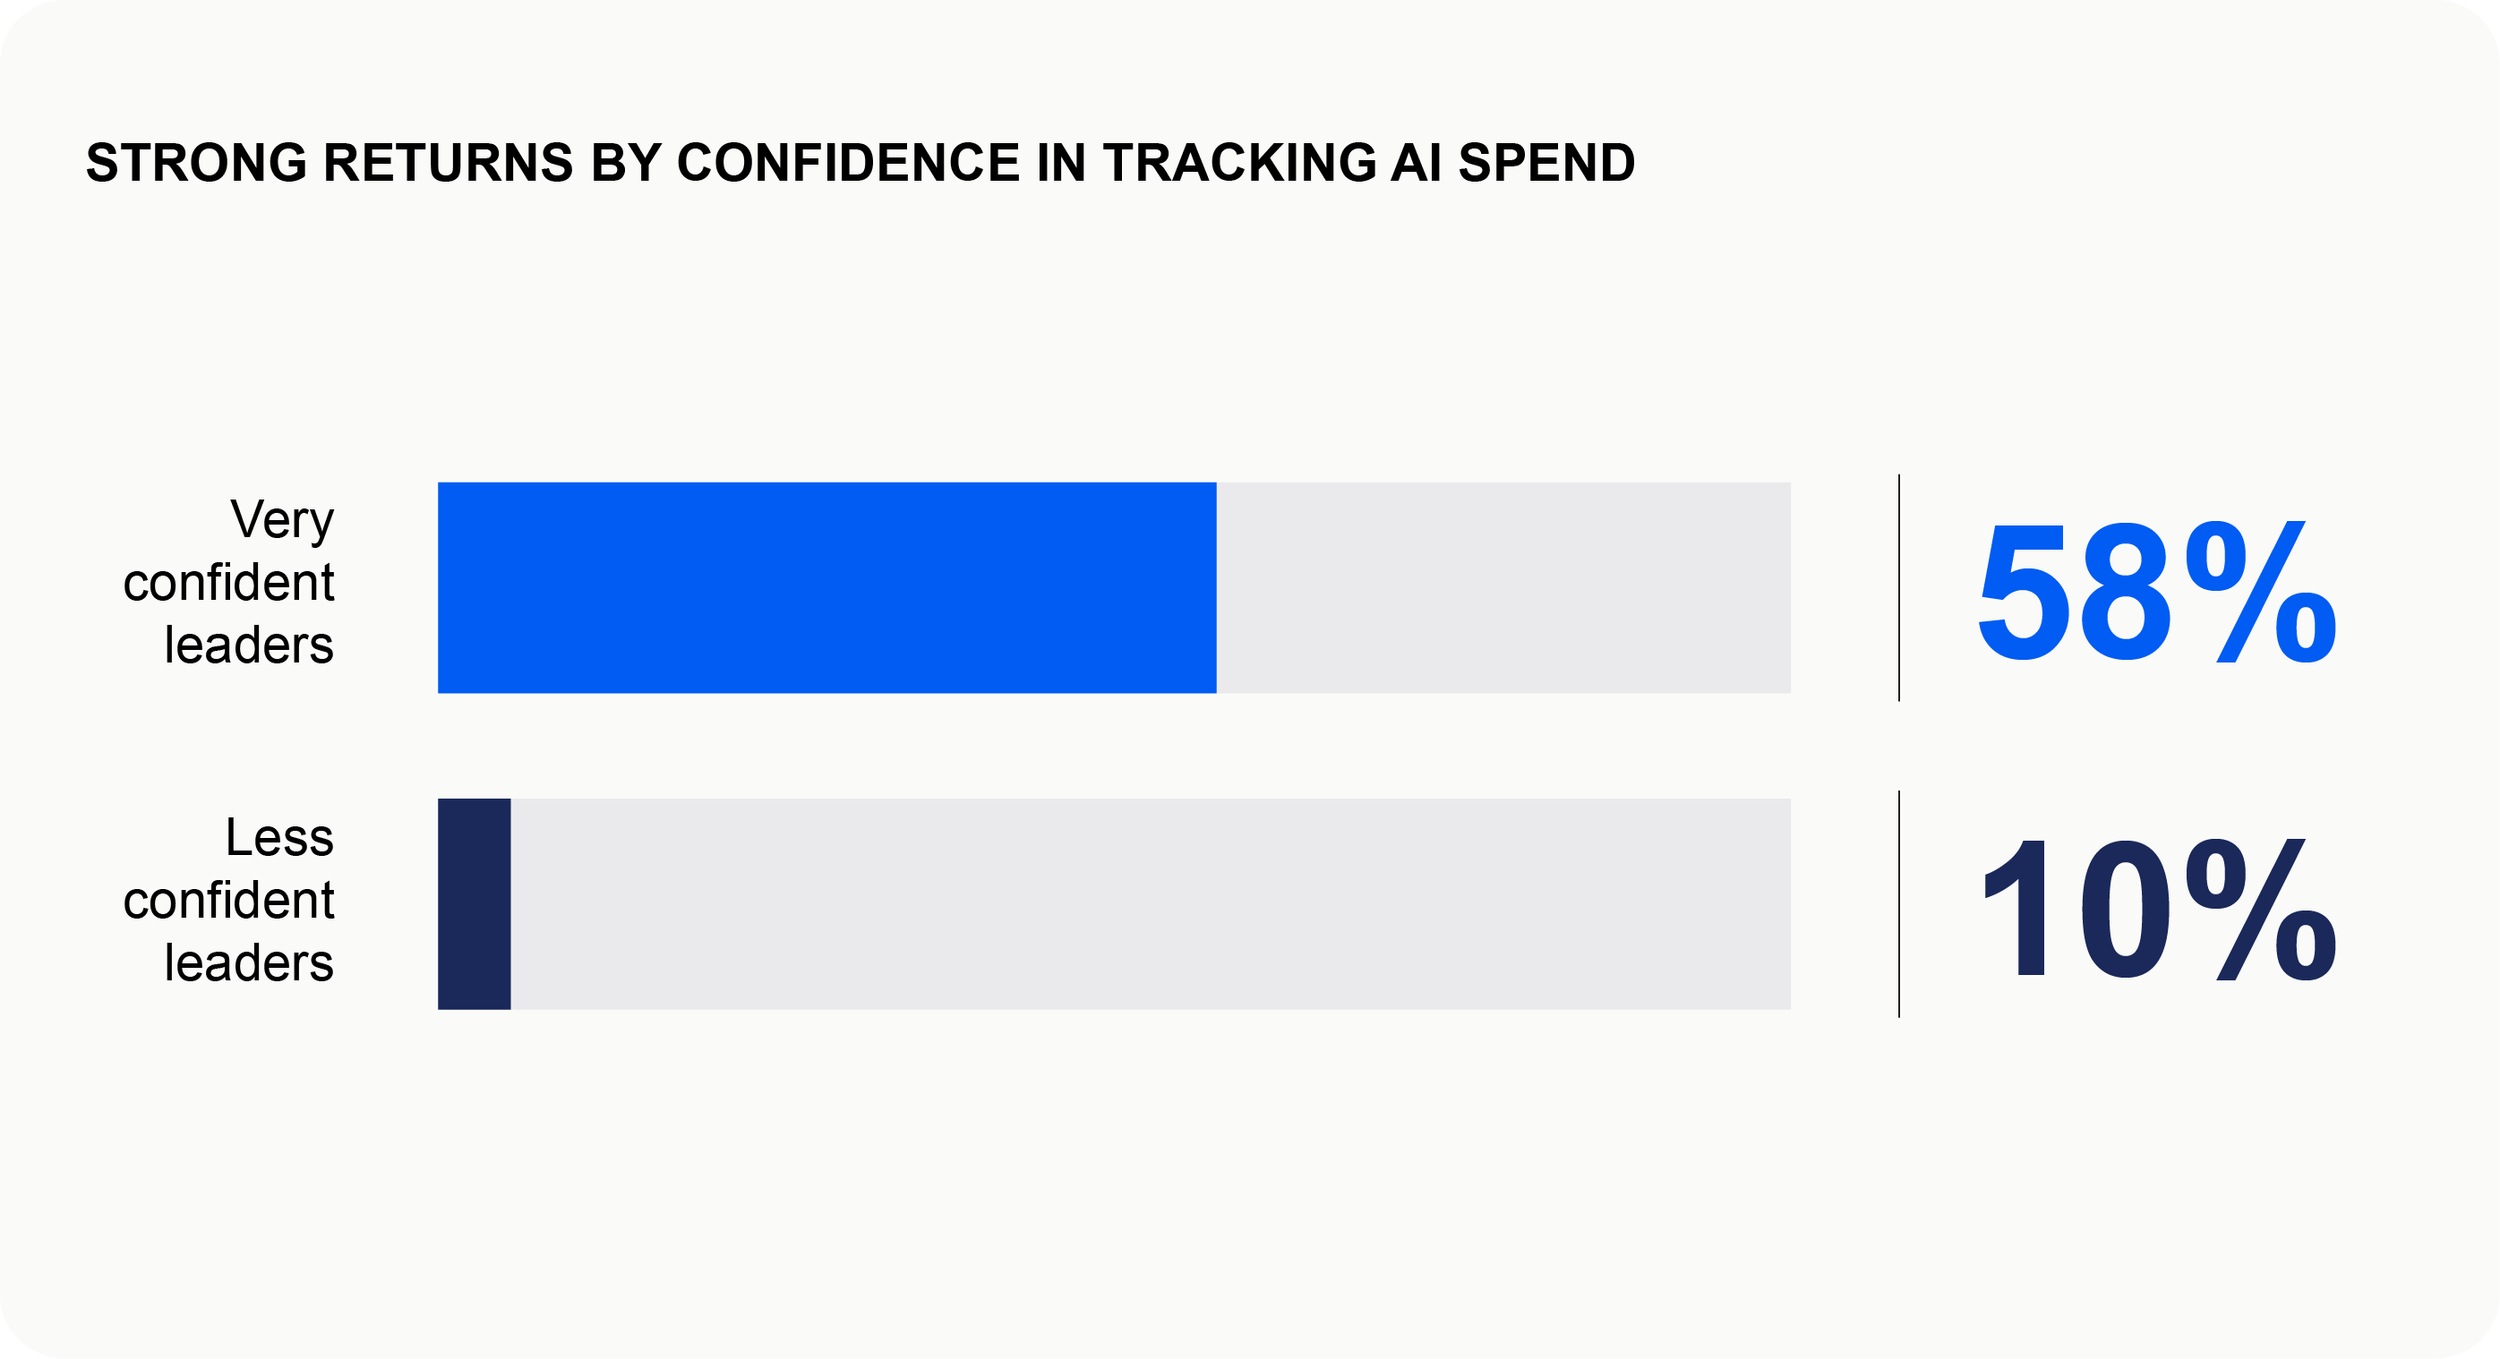
Leader and employee responses are reported separately and never combined. Year-over-year trends appear only where question wording, scale and base are consistent; where any of them changed, 2026 stands on its own. Before a relationship earned an interpretive headline, we tested whether it held once department, industry, company size, and seniority were accounted for. Where a pattern has another plausible explanation, the report names it. Leaders very confident in their ability to track total AI spend report strongly positive returns at 56%, versus 10% of less confident leaders. Those respondents are also more enthusiastic about AI in general, so part of the difference may reflect conviction rather than capability. The report says so directly on the same page as the finding.
04 Reporting Results That Complicate the Narrative
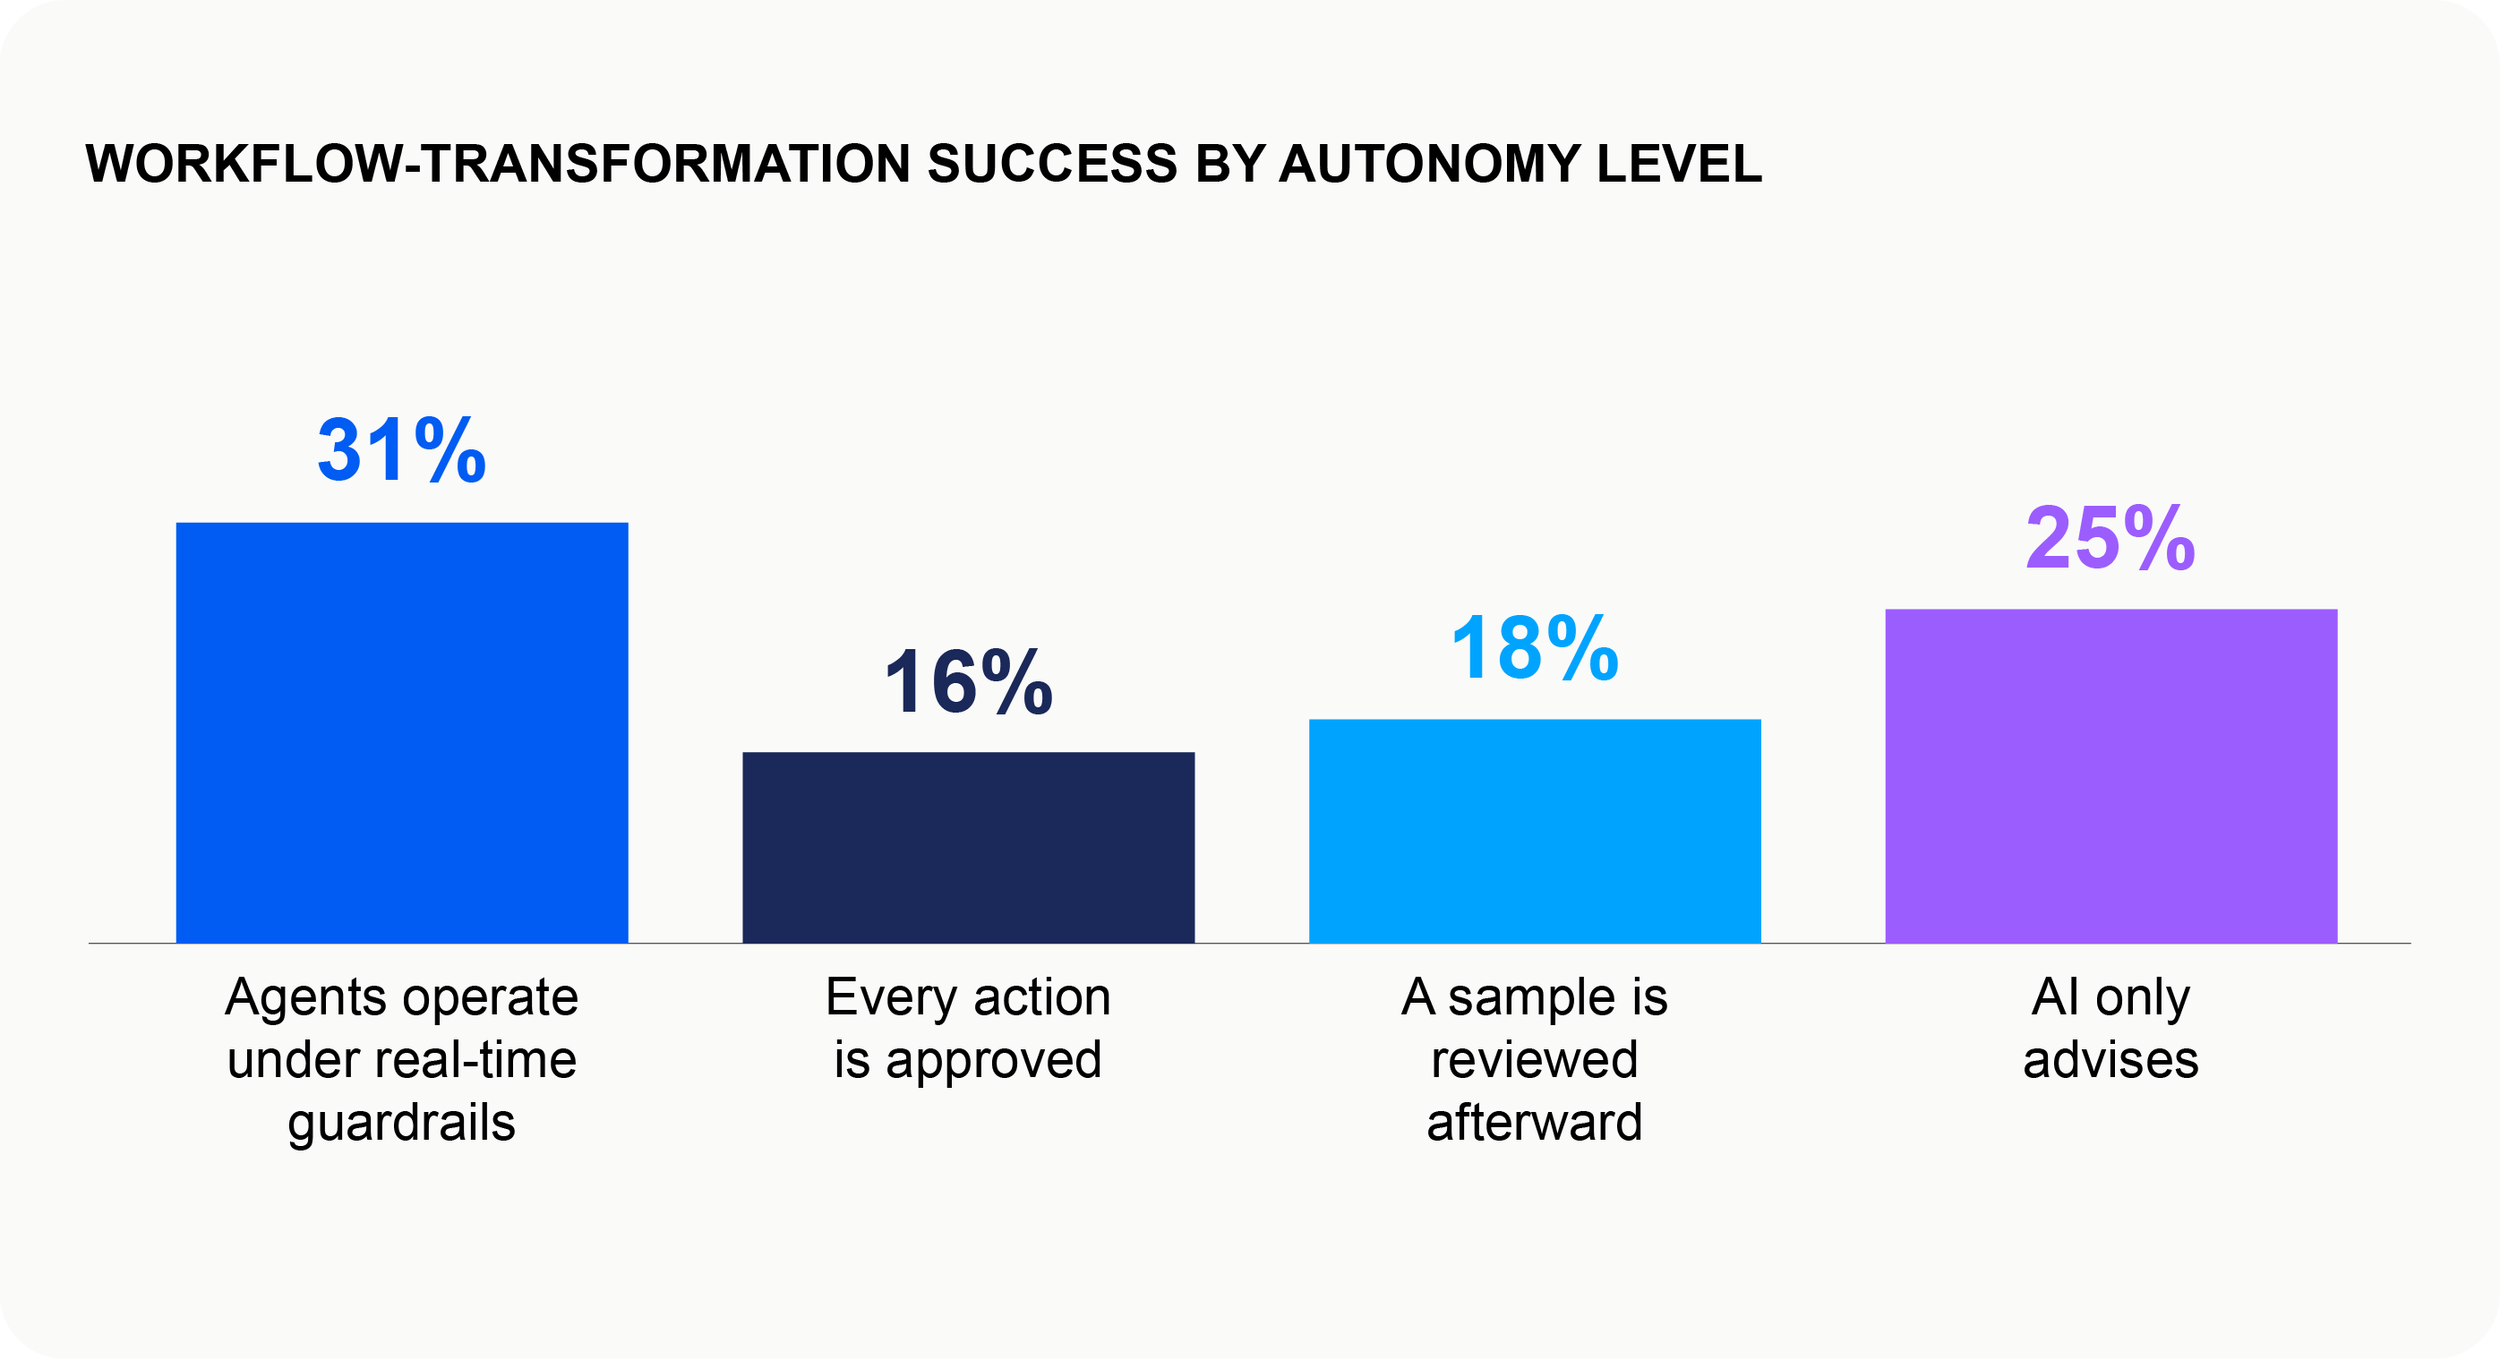
Two findings in this year’s data run against common assumptions. The first concerns agents. In 48% of departments, AI performs the work and a person approves it before anything happens. That arrangement feels prudent, but it is where workflow transformation is weakest: 16% where every action is approved and 18% where a sample is reviewed afterward. Transformation is highest at the two ends of the autonomy scale, 31% where agents operate under real-time monitoring and guardrails and 25% where AI only advises. Return follows the same shape, and the pattern holds after the controls described above. The guardrails group is small (68 respondents), so that figure should be read as directional.
The second concerns jobs. While 37% of managers and above report AI-related staff reductions, departments with strongly positive ROI report no more staff reductions or hiring freezes than others. What sets them apart is reorganization: 64% have changed their management structure because of AI, against 47% of other departments, and they are more likely to monitor AI use, build it into performance reviews and train employees adequately.
Implications for Enterprise Measurement
Three questions apply to any organization evaluating its AI investments:
How is "strong" return defined, is that one number or several, and was it set before anyone declared success?
Which perspectives are absent from the current view?
Which results would hold up in front of a skeptic, and what alternative explanations remain?
These are the measurement questions we bring to every engagement, applying academic rigor to commercial decision-making from study design through final analysis, so that conclusions can withstand scrutiny and guide action.
Study: online survey of U.S. enterprise organizations (1,000+ employees, $50M+ revenue), fielded July 9–29, 2026. Managers and above, n=1,007; entry- and mid-level employees, n=409.